The identification of dyes is a topic of high relevance considering that a vast sum our cultural heritage is textile-based, stretching back thousands of years. Moreover, textiles are some of the most sensitive objects to exhibit and store, making their analysis particularly crucial. Take, for example, a historic tapestry or an elaborate costume—you can imagine that one of these objects can alone yield several different samples, each imbued with its own complex mixture of dyes. However, it can often be difficult to identify some of the mixtures present in a sample. First, there is a vast number of dyes, natural and synthetic, available to artists and craftspeople when creating works. Second, impurities resulting from nuances in dying methods or batch-to-batch differences can contribute to the overall chemical fingerprint of each sample. Third, chemical instability can produce degradation products from age or historic use, which complicates matters even further.
Conservation scientists need a robust method to help devise holistic strategies for preservation and exhibition based on dyes present in an object, and chromatography is perhaps best equipped for providing answers to these questions. Chromatography works by separating mixtures into their individual components using both a stationary phase, or the filter through which your molecules flow, and a mobile phase, the liquid that carries your molecule through the filter.
I bet you have done this before as kids! Remember drawing a line with permanent marker on a piece of coffee filter and soaking its edge in water? A rainbow of colors would then spread across the filter paper! Here, the marker is our sample, the filter paper the stationary phase, and the water the mobile phase—and the rainbow is all the individual pigments used to make a black! Even more advanced liquid chromatography methods rely on the same model as the marker and filter paper. At the University of Amsterdam (UvA), Pirok et al. demonstrated the application of 2-dimensional liquid chromatography (2D-LC) coupled with mass spectrometry (MS) for universal classification of complex mixtures that contain both natural and synthetic dyes. Here, the stationary phase is a column, the contents of which are modified to separate analytes based on qualities such as size or charge. Each component of the mixture elutes from column into a detector at a particular moment, or retention time, depending on its relationship to both phases. All these elements are connected through microtubing that circulates the mixtures from the liquid sample through the columns into detectors of choice.
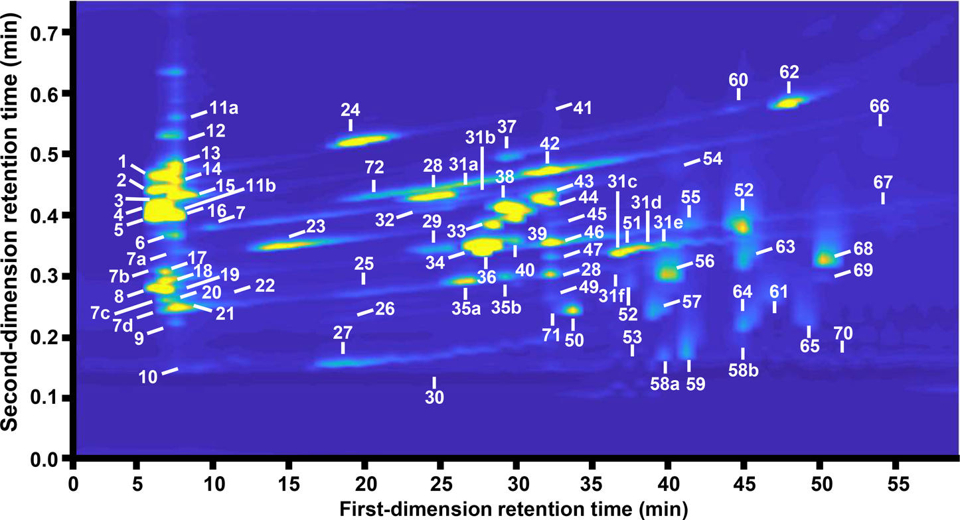
At UvA, they chose to flow a reference mixture of 80 natural and synthetic dyes through two columns for robust separation to establish a set of retention times per dye. Of the two columns, the first separates using a strong anion-exchange mechanism, where more negatively charged molecules take longer to elute out of a column with cationic packing. The second separates based on hydrophobic behaviour using a fast ion-pair reversed-phase mechanism, where analytes elute quicker with increasing hydrophobicity. The eluting dyes were then identified in two ways: spectroscopically using a UV-visible diode array detector and structurally using MS. A typical 2-D LC chromatogram (Figure 1) separates over both dimensions representing each column, and you can see how each dye has a signature time at which it elutes using their setup.
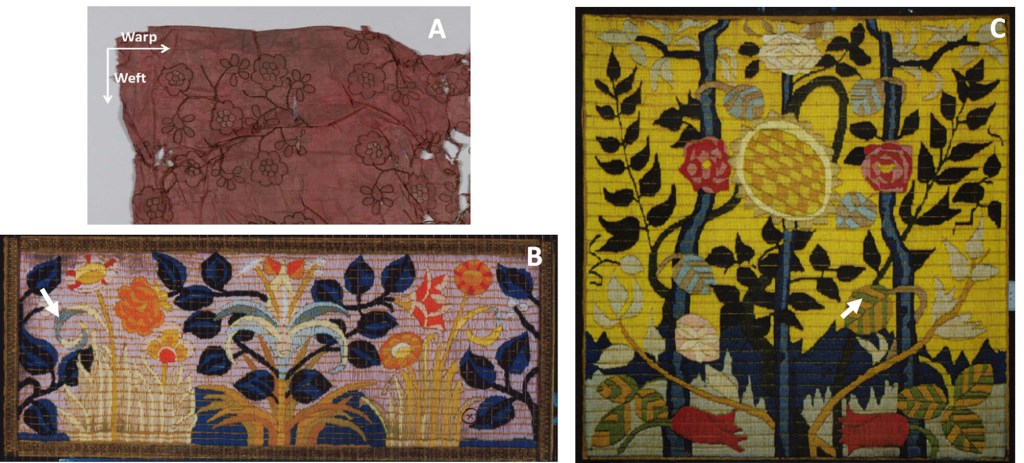
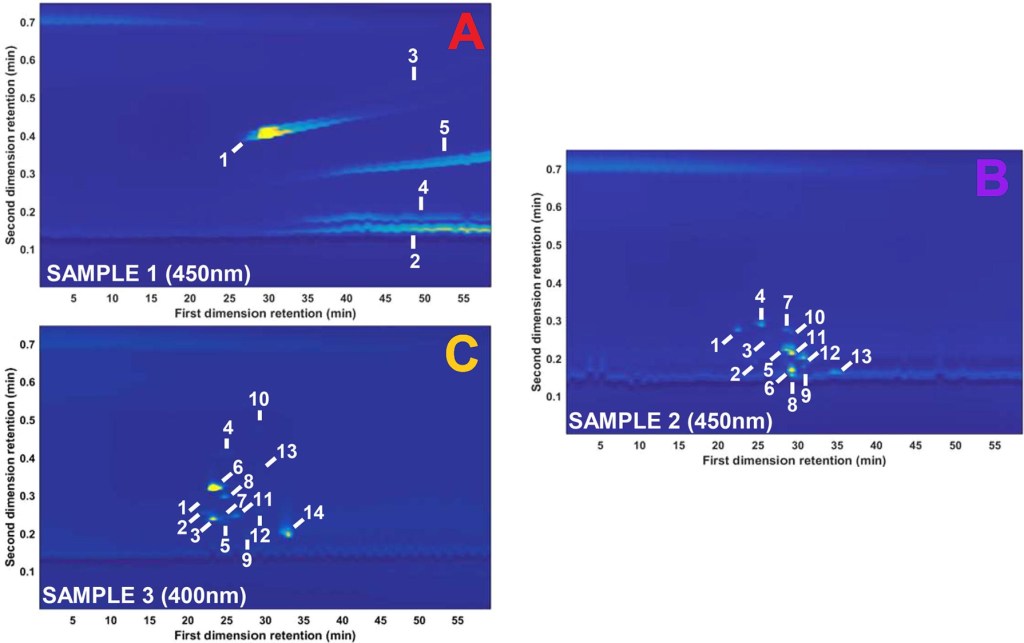
However, for any method to be truly powerful, it must identify dyes from real samples. To that end, they analyzed a sample from a red textile found inside a 17th-century shipwreck discovered in the Wadden Sea off the northern coast of The Netherlands (Figure 2A) and samples from embroideries (Figures 2B, C) by Emile Bernard (1868 –1941). The main components identified in the red textile were alizarin (1), carminic acid (2), and purpurin (3), in addition to two unknown compounds (4,5) (numbers in parentheses correspond to Figure 3A). The main components in the first Bernard sample show the presence of patent blue V (4) as the main component, and the high separation power of this method also identified multiple isomeric degradation products of patent blue V (5, 6, 7, 9, 11, 12), as well as water blue IN dye (8) and possible contaminants (2, 3, 13) (numbers in parentheses correspond to Figure 3B). The second Bernard sample contained quinoline yellow (4, 5, 12, 13), flavazine L (7), yellowish light green SF (8), orange II (9, 10), tartrazine (14), in addition to several possible contaminants (1, 2, 4, 5, 9, 10) and degradation products (12, 13) (numbers in parentheses correspond to Figure 3C).
Clearly, this method can separate and detect similar dyes, contaminants, and degradation products from cultural heritage objects, which makes it a promising tool for future analyses of unknown dyestuff.
All figures were reproduced/adapted with permission from Pirok, B. W. J.; den Uijl, M. J.; Moro, G.; Berbers, S. V. J.; Croes, C. J. M.; van Bommel, M. R.; Schoenmakers, P. J. Anal. Chem.2019, 91 (4), 3062–3069
